Organization of the TRACES Project
The TRACES Project is organized around 6 Workpackages or Tasks, as shown in the Figure below:
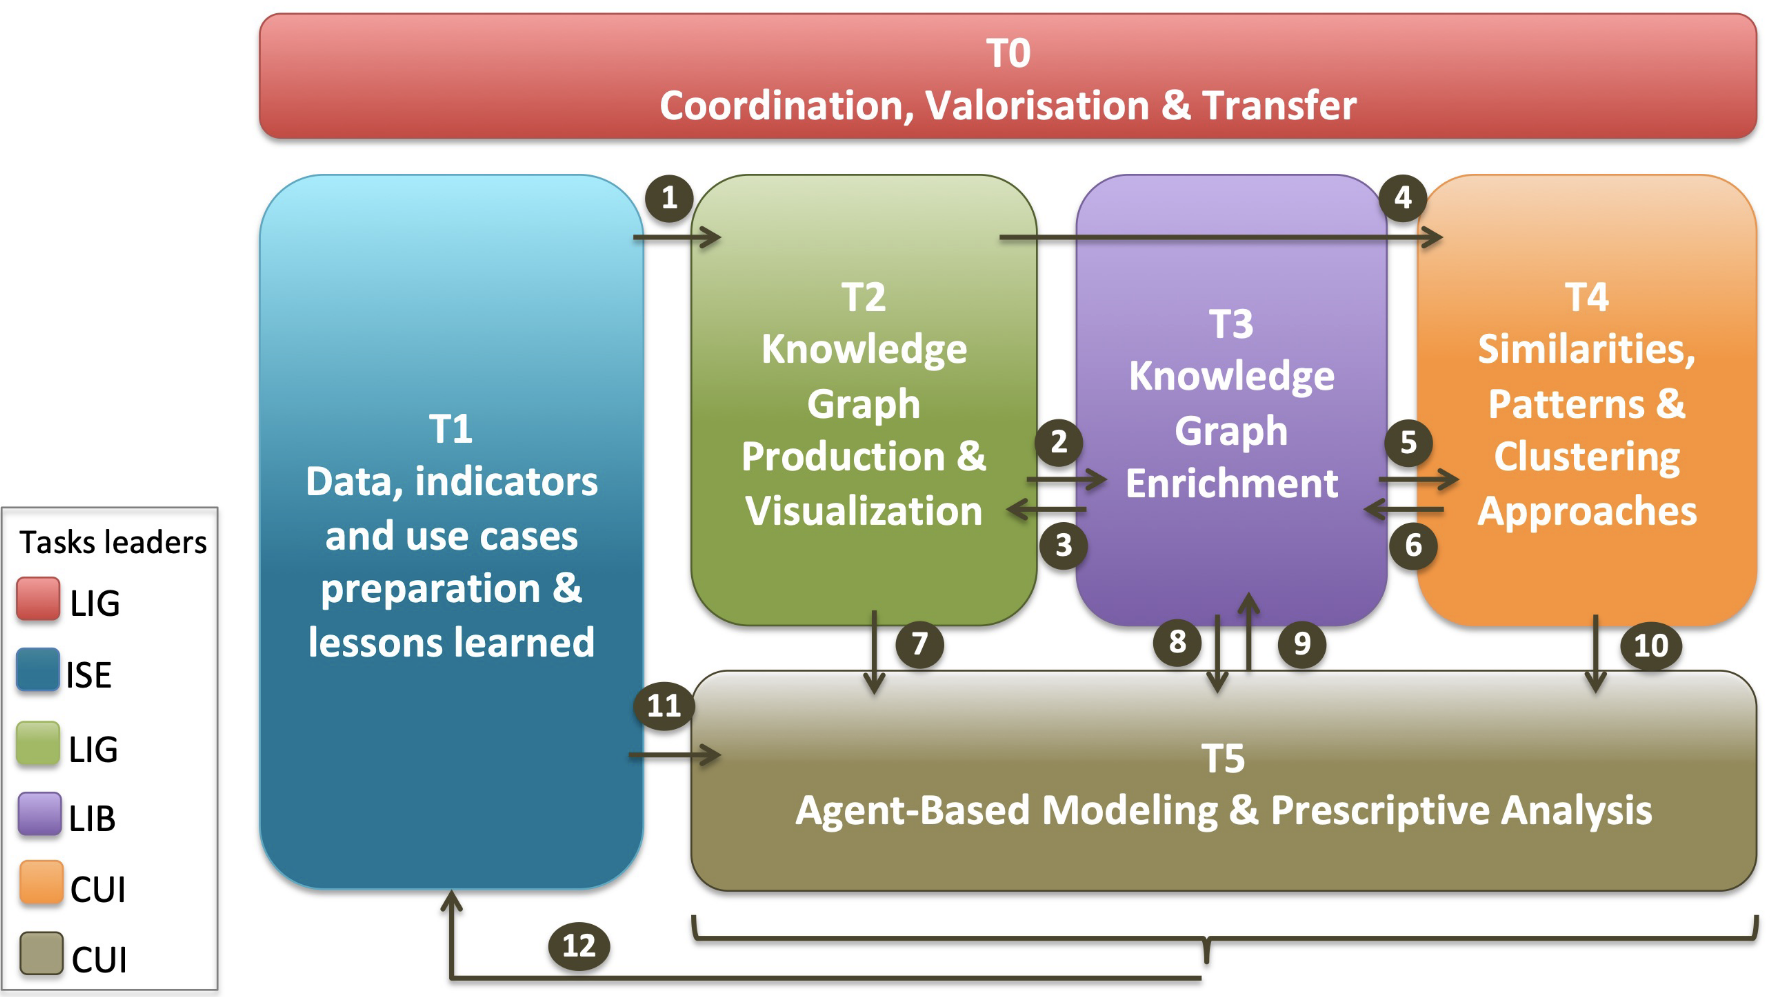
To achieve the scientific and technical objectives, the TRACES project relies on one classical Coordination, Valorisation and Transfer Task (Task 0) plus five scientific Tasks (Tasks 1 to 5). The Figure shows the six tasks and their interactions that can be interpreted in terms of input-output.
- Classically, Task T0 is dedicated to the coordination, valorisation and transfer.
- Task T1 elaborates the environmental trajectories, the indicators they rely on, the associated data, and selects the case studies and the validation scenarios.
- Task T2 builds on the results of task T1 (arrow 1) to develop the ontological model, as well as the RDF Data cube constructed as a semantic repository of indicators and data to be used. It generates the KGs of semantic environmental trajectories and proposes an adapted multi-modal visualization.
- KGs developed by task T2 are then enriched by task T3 (arrow 2), which, conversely, may lead to the modification of the ontological model of the environmental trajectories (arrow 3). The analysis of the trajectories is carried out by tasks T4 and T5.
- Task T4 performs comparative and classificatory analysis on the environmental trajectories using Machine Learning approaches. From the KGs delivered by task T2 (arrow 4) and by T3 (arrow 5), it elaborates and displays recurrent patterns extracted from environmental trajectories and the clusters they form. It also exploits and adapts sequence prediction techniques to predict future environmental trajectories. The results of the analysis carried out in this task will be used to complete enriched graphs produced by task T3 (arrow 6).
- Task T5 develops an agent-based approach to describe and better understand the environmental trajectories of territories in terms of behaviour, influencing factors and interaction, and finally to propose a predictive analysis according to various evolution scenarios. Task T5 uses KGs produced by task T2 (arrow 7).
Knowledge on environmental trajectories used by the agents will be provided by task T3 (arrow 8). Conversely, the knowledge produced or used by the agents will complement the graphs enriched using Linked Data produced by task T3 (arrow 9). Similarly, the knowledge resulting from the comparisons and predictions of task T4 can also be exploited by the agents (arrow 10). The agents will build on the case studies and scenarios developed by task T1 (arrow 11). Lastly, the results produced by Tasks 2 to 5 will be used by task T1 (arrow 12) for a “lessons learned” activity, which can be seen as a process of continuous improvement through a permanent feedback all along the project.