Here are described the results of the TRACES project to date
Study Areas
The TRACES Project focuses on 3 study areas in Switzerland and France
- Fribourg study area (127 Swiss municipalities around and including Fribourg)
- Grand Genève study area (209 Swiss and French municipalities around and including Genève)
- Évian (45 French municipalities around and including Évian)
for a total number of 317 municipalities (see Figure 1 and Figure 2)
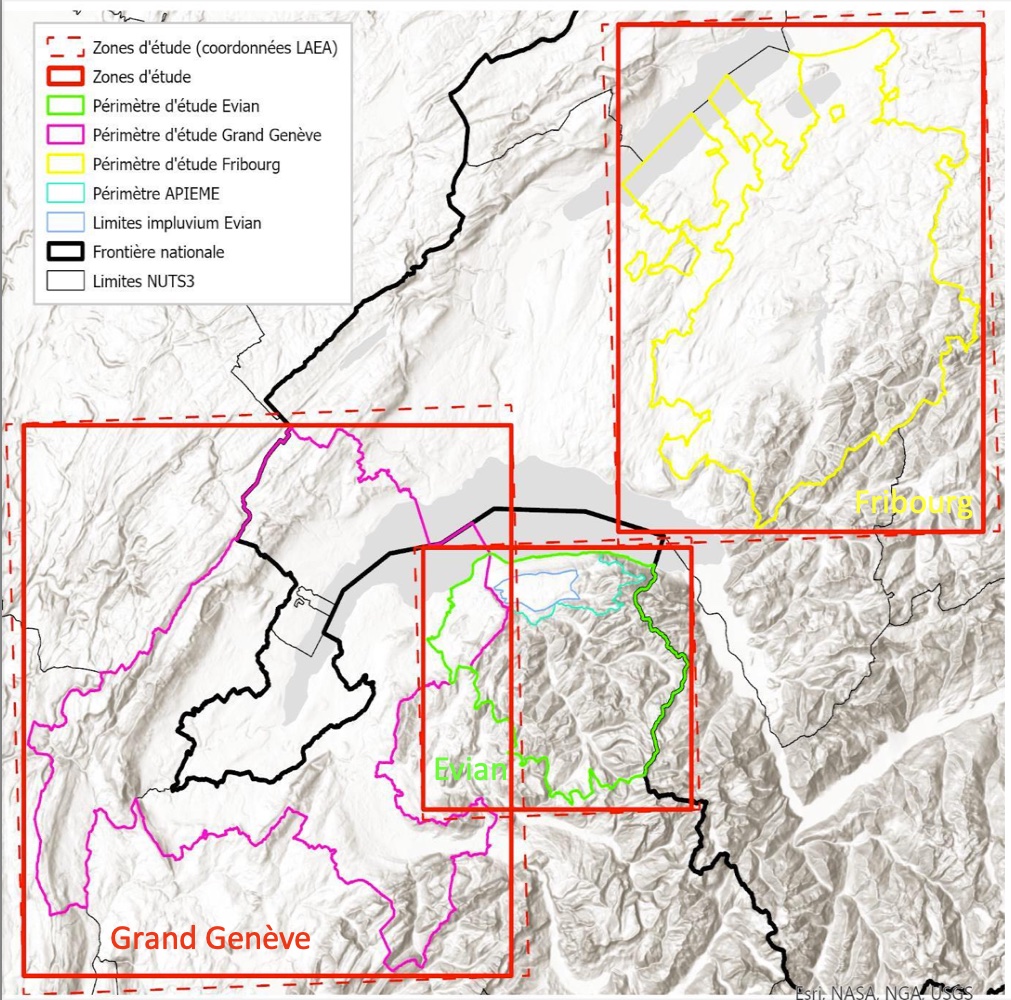 Fgure 1: The 3 TRACES Project study areas.
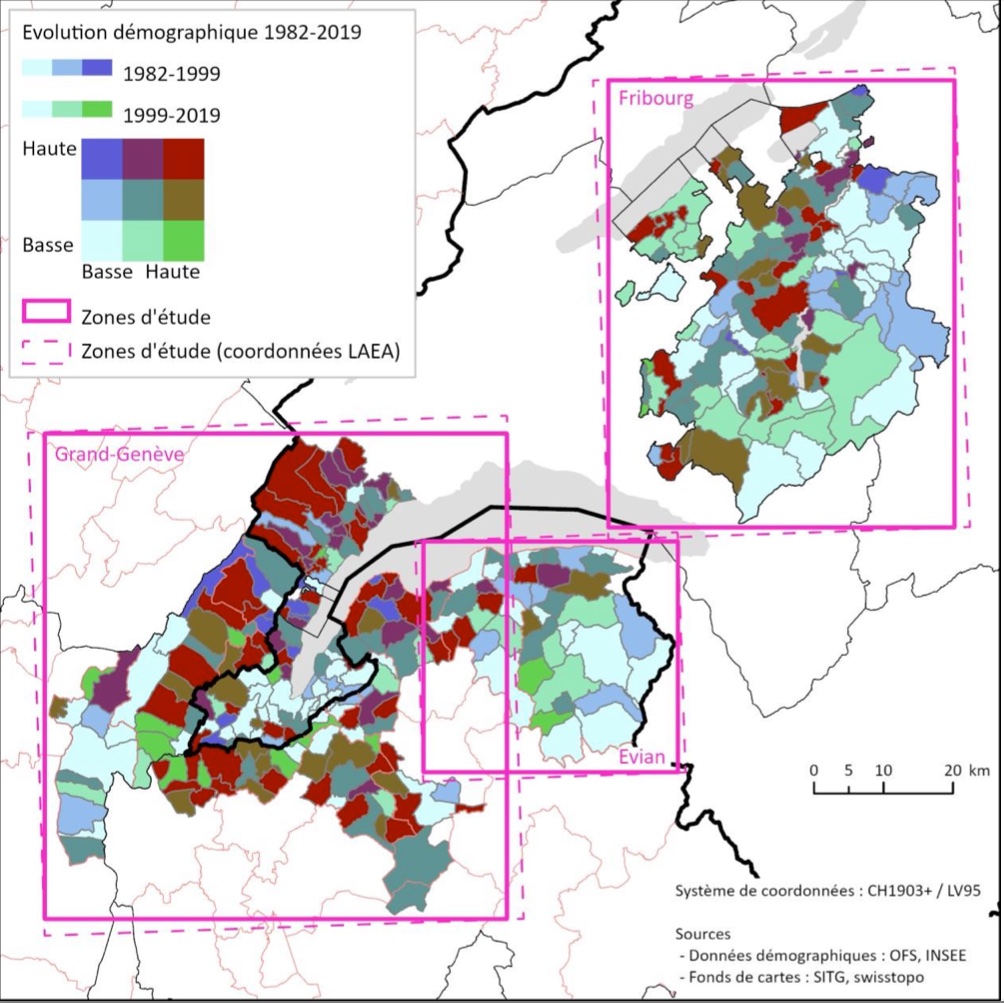
Figure 2: Demographic Evolution of the 3 study areas.
Datasets and TRACES Environmental Indices (TEIs)
The TRACES project uses Environmental Indices (we here call TEI for TRACES Environmental Indices) which assess various environmental characteristics for each pixel of a sattelite image. These raw data are available through the Swiss Data Cube (SDC) for all the municipalities of the 3 study areas.
- LIS: Landsat IndiceS
- LST: Landsat Surface Temperature
- CLC: European and Swiss (1990 only) Corine Land Cover (CLC)
- DEM: Digital Elevation Model (DEM), elevation and slope
- aux_data: region auxiliary data
- …
TEIs can be found at https://gricad-gitlab.univ-grenoble-alpes.fr/steamer/traces-prci/-/tree/main/GRID_TEIs
While 5 observations (years 1990, 2000, 2006, 2012, and 2018) are available for CLC, LIS and LST observations are available over the period 1985 up to 2022 about one a week (about 2000 observations for each TEI and for each municipality).
The transfer of pixels from satellite images to municipal outlines has been performed using Python and R.
The results of these transformations are available as csv files. Each CLC observation measure (considering 15 CLC classes) is available in two units (HA and %). Each LIS and LST observation has three measures: mean, standard deviation, and data quality, with various attributes such as celsius degrees (◦C), percent- age (%) and unitless attributes (-).
LIS (Landsat IndiceS) metadata are available through GeoNetwork at https://traces-gn.unepgrid.ch/geonetwork/
TEIs RDF Data Cubes
A first step towards the generation of Semantic Environmental Trajectories for the observed territories (the 317 municipailites, here) have been accomplished through the design of RDF Data Cubes.
RDF Data Cube (QB) is a W3C-standard ontology, aligned with OLAP (Online Analytical Process- ing) concepts, that focuses on publishing data according to a multidimensional model, in the form of open-linked data cubes. This approach gives the QB vocabulary significant potential to integrate heterogeneous data that share standard dimensions, such as time and space, as well as, to semantically enrich EO data by linking it to various Linked Opend Data resources.
TRACES RDF Data Cubes are available at: http://steamerlod.imag.fr/repositories/TRACES
A SPARQL endpoint allows for querying the TRACES RDF Data Cubes: https://steamerlod.imag.fr/repositories/TRACES?query=select%20*%20Where%20{?s%20?p%20?o%20.}%20LIMIT%2010
Some examples of SPARQL queries, can be found
· Cubes > Queries > Spatio-Temporal
· Cubes > Queries > RDF Data Cube Components
· Cubes > Queries > OLAP based
TEIs visualization (coming soon)
From TEIs to Environmental Processes
From (raw) Earth Observations Data such as TEIs, the TRACES project main objective is to produce Semantic Environmental Territorial Trajectories (SETTs).
A SETT will describe the evolution of a given territory over a given period of observation (here 1985-2022).
LIS and LST are useful indices that describe environmental features regarding snow, urban, water, or vegetation land cover, or even ground temperature, at the satellite image pixel level. Expertise is needed to interpret such indices and there is no immediate, simple formula for translating these satellite image measurements into indicators that are more accessible to the general public and citizens.
Such indicators would correspond to environmental processes that are currently posing challenges for regions and are the subject of local or global policies. These environmental processes can be classified in the following categories:
- land cover / land use
- soil artificialisation => land degradation
- urban sprawl and its opposite, densification => urban sprawl
- biodiversity
- biodiversity loss
- habitat fragmentation
- climate, air
- drought
- urban heat islands
- air pollution
- water
- hydrology => water scarcity
- water pollution
Three processes have been selected as test cases because of the availability of data on these issues: land artificialisation, urban sprawl and drought.
Semantic Enrichment
The transformation of data (Big Data) into information/knowledge about environmental trajectories is part of the semantisation sought in the TRACES project. The other part involves linking it to data that can be interpreted by humans or used by machines. This linked data can be controlled vocabularies, metadata, ontologies, knowledge bases, etc. (see Figure 3).
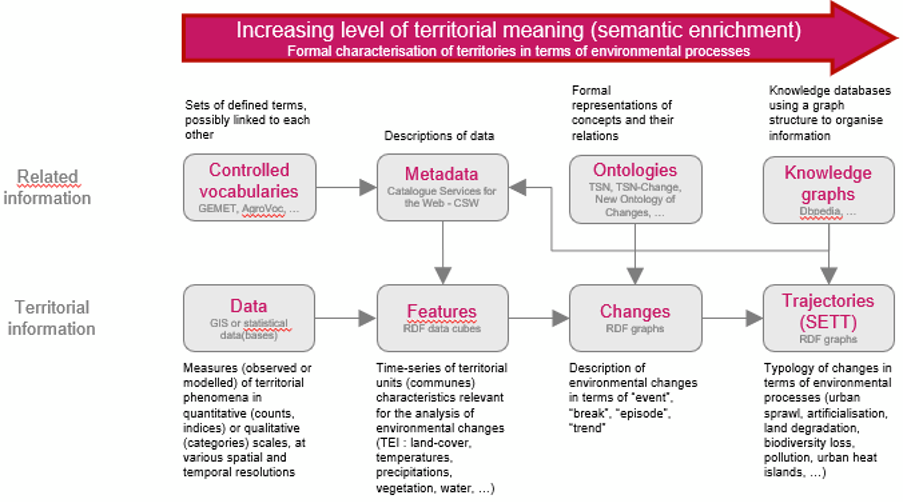
Figure 3: The TRACES Semantic Enrichment Data Flow
The TRACES DPSIR Model
The DPSIR analytical framework enables an environmental process to be approached through a representation of the states (S) of the phenomenon concerned as well as their causes (driving forces – D and pressures – P), their consequences (impacts – I) and the responses made (R).
At the heart of our DPSIR analysis is the evolution of land cover (see Figure 4), which enables us to assess the artificialisation of land and urban sprawl (States). From the land cover categories, it is possible to derive information on built-up areas and agricultural, forestry and natural areas as recorded in Swiss and French national statistics. This information on built-up areas can then be used to measure urban sprawl, either by cross-referencing with demographic data (intensity of built-up areas in relation to population growth), or by analysing the spatial distribution of built-up areas.
As for drought, it is addressed here from the angle of the water content of soils and vegetation and considered as one of the impacts of changes in land cover – and therefore of urban sprawl and artificialisation – which amplify the effects of climate change.
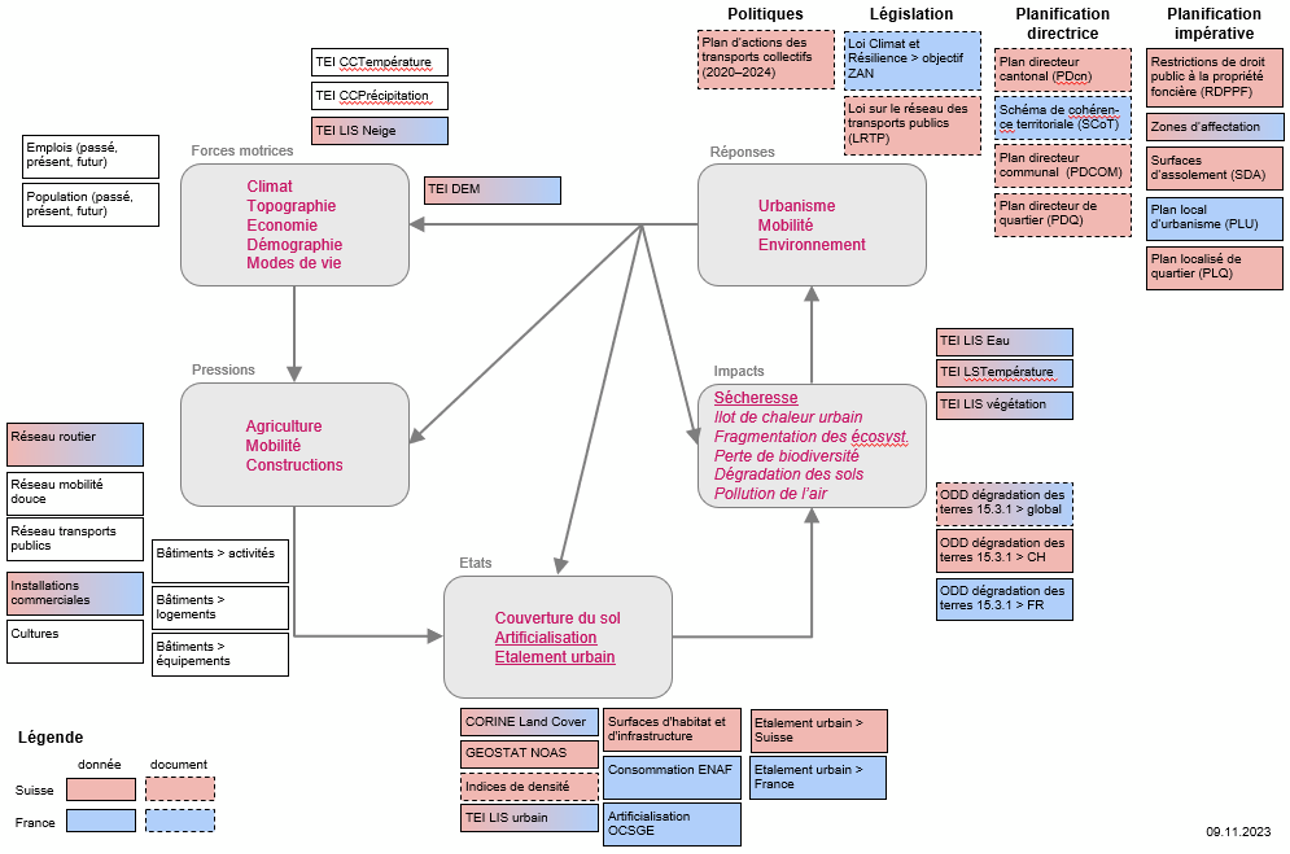
Figure 4: The TRACES DPSIR Model
The TRACES DPSIT Model is a keystone for the Semantic Enrichment of TEI data and a essential step towards SETTs.
Agent-based modelling
Multi-agent systems are an artificial intelligence technique where the traditional approach to modelling is flipped over: we represent individual entities – called agents – with their own behaviours, memories and interactions with their environment and other agents, and equip them with their own set of actions and evolution rules.
With the help of agent-based modelling, we investigate how to create models that will be able to perform descriptive, predictive and prescriptive analysis of the dynamics of land cover change and other urban development patterns. Furthermore, we will harness the organized information contained inside knowledge graphs so as to directly enrich the agents’ own available knowledge about their environment.
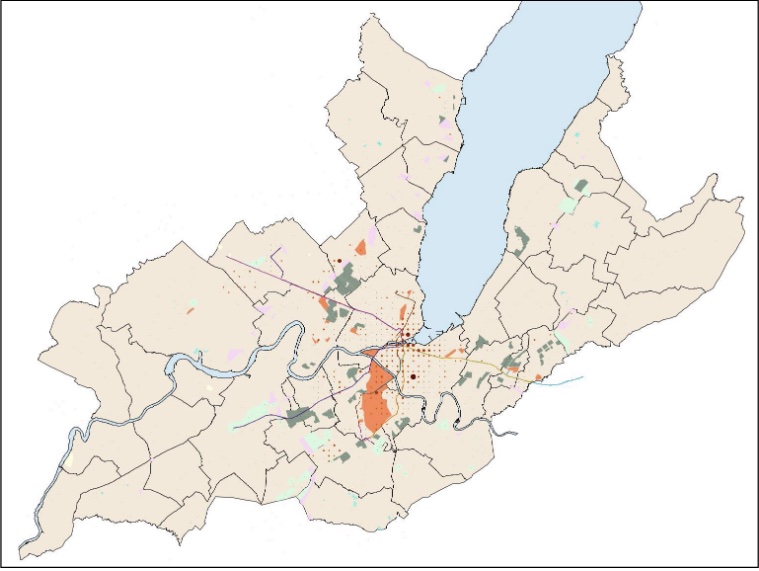
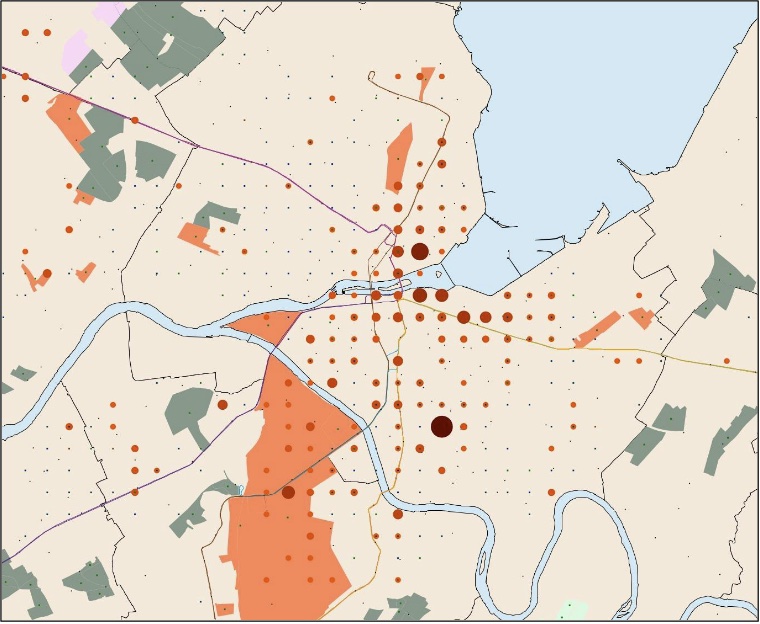
We developed a first model focusing on the Cornavin-Meyrin-CERN tram axis, and represented commuting behaviours along this major axis of transport. From the individual commutes of each agent, macroscopic behaviours emerge, such as transportation network saturation. A video of the model is available at: https://www.youtube.com/watch?v=zD009fGOXrg
We also developed a second model, spanning over the whole canton of Geneva, which incorporates both the DPSIR framework as a basis for crafting evolution rules, and the Geneva public transportation API as a massive external source of data for the agents to harness, further grounding the model. The model predicts hotspots of residential districts emergence or densification, in function of various journey-to-work commute time statistics. Below, a few snapshots of the model. This webapp interactively showcases an example output dataset from the model: https://dpsir-model-app.azurewebsites.net/